Metrics system
Metrics system is responsible for collecting metrics from various components of the AIOS system, aggregating, storing and serving them for queries. Metrics in AIOS system can be classified into 3 types:
1. Hardware metrics: Hardware metrics are collected from clusters and nodes, hardware metrics capture the hardware utilization information like CPU usage, Memory usage, GPU usage etc.
2. Block metrics: Block metrics capture the runtime metrics of the block and it's instances like latency, throughput, queue length etc, the block metrics can also include custom metrics implemented using AIOS SDK in the instance code.
3. vDAG metrics: vDAG metrics includes the metrics captured by the vDAG controller which includes the metrics like end-to-end latency of the vDAG, average throughput etc.
Architecture
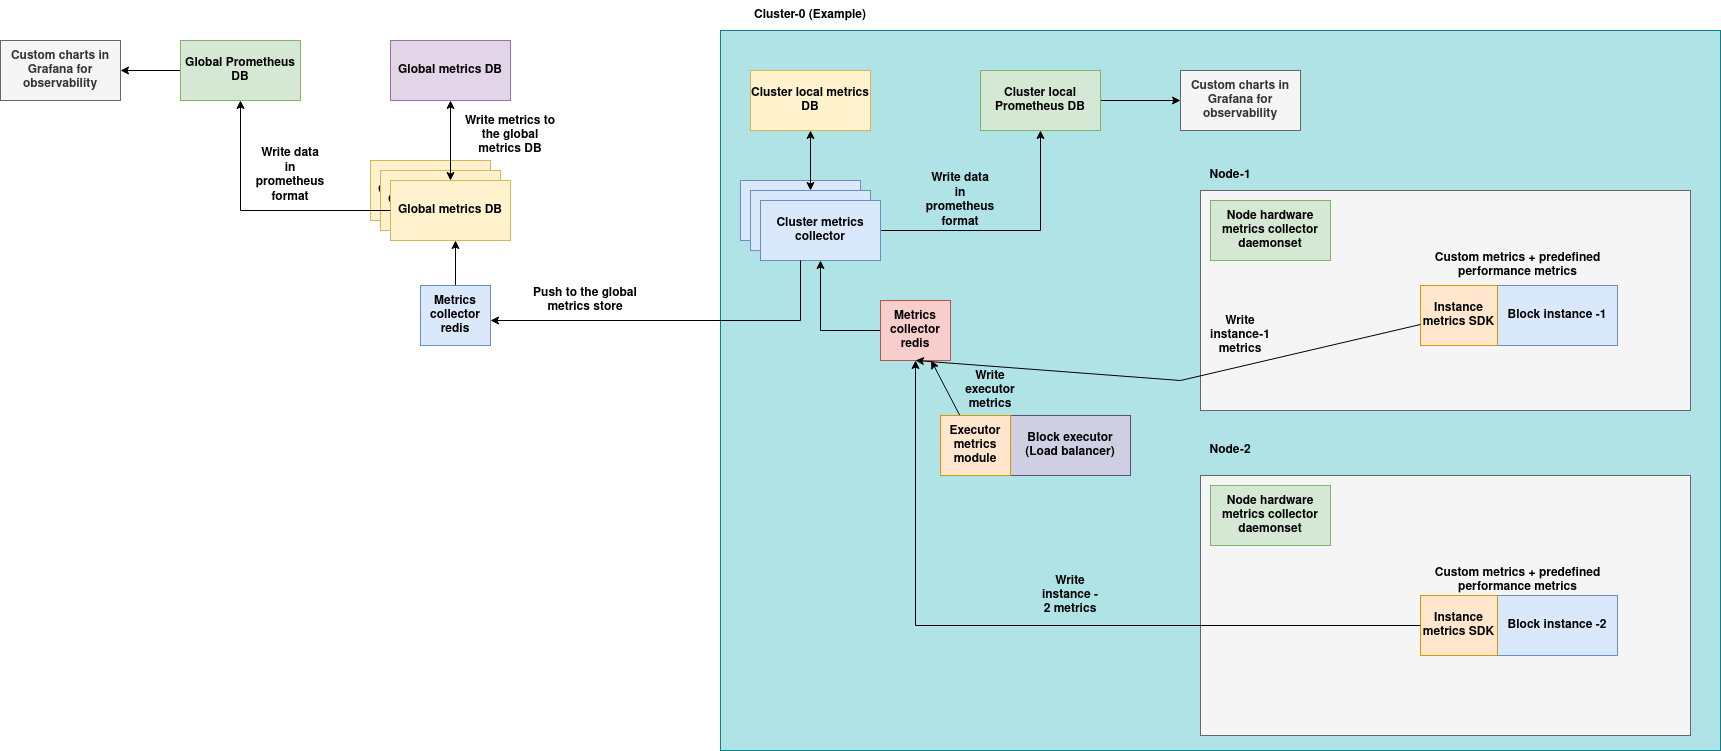
(Download the architecture diagram)
Components:
Cluster metrics components:
1. Node hardware daemonsets: These pods are deployed on all the nodes of the cluster by default, this pod runs in the host mode and is responsible for collecting all the metrics like CPU, memory, disk, network and GPU usage.
2. Metrics SDK and executor metrics module: The metrics SDK provides capabilities to instrument custom metrics in the application and it is also integrated with the aios SDK to implement the built-in metrics, the metrics SDK is also configured to push metrics to the cluster's local metrics database periodically.
3. Local cluster metrics database: Local cluster metrics database stores the current metrics of all the blocks and nodes in the cluster, this DB only stores the current metrics and not time-series data, the local metrics database is backed by prometheus deployment on the cluster which is optional, the prometheus deployment can be configured to store metrics for a long duration of time based on the local storage availability. Grafana charts can also be built on the prometheus metrics for observability.
Global metrics
1. Global metrics databases: Global metrics databases stores metrics reported from all the clusters, this DB only stores the current metrics and not time-series data and the global metrics databases are backed by prometheus deployment on the management cluster which is optional, the prometheus deployment can be configured to store metrics for a long duration of time based on the local storage availability. Grafana charts can also be built on the prometheus metrics for observability.
Hardware metrics:
Hardware metrics are collected from clusters and nodes, hardware metrics capture the hardware utilization information like CPU usage, Memory usage, GPU usage etc.
Node metrics Daemonsets:
This pod is deployed as a daemonset on every node that joins a cluster, this pod runs in the privileged mode and thus it has access to all the host machine hardware information. Node metrics daemonset collects the metrics from the host node at fixed intervals and pushes it to the local metrics DB service where it gets saved in the DB.
Types of metrics collected: 1. CPU metrics (using psutil) 2. Memory metrics (using psutil) 3. Storage metrics (using psutil) 4. Network metrics (using psutil) 5. GPU metrics - if GPUs are detected and available (using NVML)
List of metrics collected:
1. CPU
| Name | Description |
|---|---|
load1m |
System load average over the last 1 minute |
load5m |
System load average over the last 5 minutes |
load15m |
System load average over the last 15 minutes |
runningThreads |
Number of currently running threads |
runningProcesses |
Number of currently running processes |
totalThreads |
Total number of threads on the system |
totalProcesses |
Total number of processes on the system |
2. Memory
| Name | Description |
|---|---|
freeMem |
Amount of free memory on the system |
usedMem |
Amount of used memory on the system |
averageUtil |
Average memory utilization percentage |
usedSwap |
Amount of swap memory currently in use |
freeSwap |
Amount of free swap memory available |
pageFaultsPerSec |
Number of memory page faults per second |
3. Disk
| Name | Description |
|---|---|
memory.freeMem |
Free disk memory |
memory.usedMem |
Used disk memory |
memory.maxDisk |
Maximum disk memory available |
memory.minDisk |
Minimum disk memory available |
iops.blocksPerSec |
Number of blocks read/written per second |
iops.readBytes |
Number of bytes read from disk |
iops.writeBytes |
Number of bytes written to disk |
iops.total |
Total IOPS (Input/Output operations per second) |
iops.active |
Number of active IOPS |
iops.response |
Average IOPS response time |
4. Storage
| Name | Description |
|---|---|
freeMem |
Amount of free storage on the system |
usedMem |
Amount of used storage on the system |
5. Network
| Name | Description |
|---|---|
txBytesTotal |
Total bytes transmitted over the network |
rxBytesTotal |
Total bytes received over the network |
6. Per GPU
| Name | Description |
|---|---|
gpu_id |
ID of the GPU |
usedMem |
Used GPU memory in MB |
freeMem |
Free GPU memory in MB |
totalMem |
Total GPU memory in MB |
memUtilization |
GPU memory utilization percentage |
cudaUtilization |
CUDA core utilization percentage |
powerUtilization |
GPU power utilization (placeholder value: 0) |
temperature |
GPU temperature |
7. Aggregated GPU metrics per node
| Name | Description |
|---|---|
totalUsedMem |
Total used memory across all GPUs (in MB) |
totalFreeMem |
Total free memory across all GPUs (in MB) |
totalMem |
Total memory capacity across all GPUs (in MB) |
avgMemUtilization |
Average memory utilization percentage across all GPUs |
avgCudaUtilization |
Average CUDA utilization percentage across all GPUs |
avgPowerUtilization |
Average power utilization across all GPUs |
avgTemperature |
Average temperature across all GPUs |
count |
Number of GPUs detected on the system |
Local Metrics database:
Local metrics database is deployed per cluster, this database is used to store the hardware metrics of the nodes in the cluster. The metrics daemonset that runs on all the nodes reports the metrics for every fixed intervals, these metrics are stored in this local database. Services like load balancer, auto-scaler of the block for example can rely on this data to make auto-scaling and load balancing decisions.
APIs of the local metrics database:
Get metrics of a node:
Endpoint: /node/<node_id>
Method: GET
Description:
This endpoint retrieves metrics for a specific node identified by its node_id. It queries the node metrics from the cluster and returns the associated data if found.
Example curl Command:
curl -X GET http://<server-url>/node/<node-id>
Query nodes that satisfy the filter condition:
Endpoint: /node/query
Method: POST
Description:
This endpoint allows querying node metrics based on a MongoDB-style query filter. The filter should be passed in the request body as a JSON object using standard MongoDB query operators (e.g., $eq, $gt, $in, etc.).
Example curl Command:
curl -X POST http://<server-url>/node/query \
  -H "Content-Type: application/json" \
  -d '{ "metrics.resource.node.vcpu.load_15m": { "$lt": 2 } }'
Get the cluster metrics object:
The complete metrics of all the nodes, the aggregated metrics of all the nodes in the cluster can be obtained by calling this API, this API is used by many components internally for decision making.
curl -X GET http://<server-url>/cluster
Global Cluster metrics DB:
Global metrics DB is used for storing the "current metrics" of all the clusters across the network, it is used for global level monitoring and decision making, all the local metrics DBs report their latest aggregated metrics to this DB at fixed intervals.
APIs of Global Cluster metrics DB:
Endpoint: /cluster/<cluster_id>
Method: GET
Description:
This endpoint retrieves metrics for a specific cluster identified by its cluster_id. If the cluster is not found, a message indicating this is returned. The data is returned as a single object.
Example curl Command:
curl -X GET http://<server-url>/cluster/<cluster-id>
Endpoint: /cluster/query
Method: POST
Description:
This endpoint queries multiple clusters using a MongoDB-style filter provided in the JSON body. It supports all standard MongoDB query operators like $eq, $gt, $in, etc., and returns a list of matched cluster metrics.
Example curl Command:
curl -X POST http://<server-url>/cluster/query \
  -H "Content-Type: application/json" \
  -d '{
    "cluster.memory.freeMem": {"$gt": 50000}
  }'
Block Metrics:
Block metrics are collected from the running block's executor and the instances of AI/Computational workload.
Default block metrics:
These metrics are embedded into the executor and AIOS instance SDK, hence these metrics are always available for any block and it's instances by default. Here are the default block metrics:
Default executor metrics:
| Name | Description |
|---|---|
tasks_processed |
Number of tasks processed by the executor |
latency |
Average end-to-end latency of tasks (in seconds) |
Default instance metrics
| Name | Description |
|---|---|
on_preprocess_latency |
Latency of the on_preprocess function |
on_data_latency |
Latency of the on_data function |
end_to_end_latency |
Total end-to-end processing latency of the job |
on_preprocess_count |
Number of times on_preprocess is called |
on_data_count |
Number of times on_data is called |
end_to_end_count |
Total number of jobs processed |
on_preprocess_fps |
Frames per second for the on_preprocess function |
on_data_fps |
Frames per second for the on_data function |
end_to_end_fps |
Frames per second for the end-to-end processing pipeline |
queue_length |
Current length of the input Redis queue for the block |
Custom metrics
Custom metrics can be implemented in AIOS instance SDK using AIOSv1Metrics library.
The AIOSMetrics class is a utility for registering and managing Prometheus-based metrics (Counters, Gauges, and Histograms) in AIOS services. It supports metric exposure, Redis integration, and labeling for use in multi-instance and multi-node deployments.
AIOSMetrics(block_id: Optional[str] = None)
Parameters:
- block_id (str, optional): A unique identifier for the current block (component). If not provided, it defaults to the BLOCK_ID environment variable or "test-block".
Environment Variables:
- BLOCK_ID: Block ID used for tagging metrics (optional if passed explicitly).
- INSTANCE_ID: Instance ID used for internal identification (default: "instance-001").
- METRICS_REDIS_HOST: Redis host for publishing metrics data (default: "<server-url>").
Public Methods
register_counter(name: str, documentation: str, labelnames: List[str] = None)
Registers a Prometheus Counter metric.
Arguments:
- name: Name of the metric.
- documentation: Description of the metric.
- labelnames: Optional list of label names to use with the counter.
register_gauge(name: str, documentation: str, labelnames: List[str] = None)
Registers a Prometheus Gauge metric.
Arguments:
- name: Name of the metric.
- documentation: Description of the metric.
- labelnames: Optional list of label names to use with the gauge.
register_histogram(name: str, documentation: str, labelnames: List[str] = None, buckets: List[float] = None)
Registers a Prometheus Histogram metric.
Arguments:
- name: Name of the metric.
- documentation: Description of the metric.
- labelnames: Optional list of label names to use with the histogram.
- buckets: Optional list of histogram bucket boundaries. Defaults to [0.1, 0.2, 0.5, 1, 2, 5, 10].
increment_counter(name: str, labelnames: Dict[str, str] = None)
Increments the specified counter metric.
Arguments:
- name: Name of the metric to increment.
- labelnames: Dictionary of label values if the counter has labels. (Currently ignored in implementation)
set_gauge(name: str, value: float, labelnames: Dict[str, str] = None)
Sets the value of a gauge metric.
Arguments:
- name: Name of the metric.
- value: Numeric value to set.
- labelnames: Dictionary of label values if the gauge has labels. (Currently ignored in implementation)
observe_histogram(name: str, value: float, labelnames: Dict[str, str] = None)
Observes a value in a histogram metric.
Arguments:
- name: Name of the metric.
- value: Value to record in the histogram.
- labelnames: Dictionary of label values if the histogram has labels. (Currently ignored in implementation)
Internal Attributes
self.metrics: Dictionary holding registered Prometheus metric objects.self.redis_client: Redis client used for optional publishing of metrics.self.stop_event: Event flag for managing background processes.self.node_id: Node identifier (retrieved fromdetect_node_id()).
Example Usage
import os
from aios_metrics import AIOSMetrics

# Set environment variables if needed
os.environ["BLOCK_ID"] = "block-123"
os.environ["INSTANCE_ID"] = "instance-xyz"

# Initialize the metrics utility
metrics = AIOSMetrics()

# Register metrics
metrics.register_counter("tasks_processed", "Number of tasks processed")
metrics.register_gauge("latency", "End-to-end latency of task processing")
metrics.register_histogram("inference_duration", "Histogram of inference durations")

# Simulate metric updates
metrics.increment_counter("tasks_processed")
metrics.set_gauge("latency", 0.432)
metrics.observe_histogram("inference_duration", 1.2)
Local Block metrics database:
Local block metrics DB stores the metrics (both default and custom) of all the blocks and it's instances running on the cluster. These metrics can be queries by the local services running within the cluster for decision making.
Local block metrics APIs:
Endpoint: /block/<block_id>
Method: GET
Description:
This endpoint retrieves all metrics related to a specific block identified by its block_id. Returns a structured data object with relevant metrics if available.
Example curl Command:
curl -X GET http://<server-url>/block/<block-id>
Endpoint: /block/query
Method: POST
Description:
This endpoint queries block documents using a MongoDB-style filter provided in the JSON body. Supports standard MongoDB operators such as $eq, $gt, $in, etc.
Example curl Command:
curl -X POST http://<server-url>/block/query \
  -H "Content-Type: application/json" \
  -d '{
    "metrics.latency.latency": {"$lt": 3}
  }'
Global Blocks metrics database:
Global blocks metrics database stores the metrics of the blocks running across all the clusters in the network, these metrics are reported by all the local block metrics databases at fixed intervals. The database also provides APIs to help the systems query the metrics information.
Global blocks metrics APIs:
Endpoint: /block/<block_id>
Method: GET
Description:
This endpoint retrieves metrics for a specific block identified by its block_id. It performs a query using the blockId field and returns the matching data.
Example curl Command:
curl -X GET http://<server-url>/block/<block-id>
Endpoint: /block/query
Method: POST
Description:
This endpoint queries block metrics using a MongoDB-style filter provided in the JSON request body. Supports standard MongoDB query operators like $eq, $gt, $in, etc.
Example curl Command:
curl -X POST http://<server-url>/block/query \
  -H "Content-Type: application/json" \
  -d '{
    "metrics.latency.latency": {"$lt": 3},
  }'
vDAG Metrics
vDAG metrics are implemented by the vDAG controller, these metrics are directly reported to the global vDAG metrics database.
vDAG metrics list
| Name | Description |
|---|---|
inference_requests_total |
Total number of inference requests processed |
inference_fps |
Frames per second (FPS) of inference processing |
inference_latency_seconds |
Latency per inference request in seconds |
Global vDAG Metrics database:
Global vDAG metrics database stores vDAG metrics from all the vDAG controllers running across the clusters in the network. These metrics are reported by the vDAG controllers at fixed intervals. Global vDAG Metrics database also provides the query APIs which can be used by the systems and users for monitoring and decision making.
Global vDAG Metrics DB APIs:
Endpoint: /vdag/<vdag_id>
Method: GET
Description:
This endpoint retrieves metrics for a specific VDAG identified by its vdag_id. If the VDAG is not found, a corresponding message is returned. On success, the data is returned as a single object.
Example curl Command:
curl -X GET http://<server-url>/vdag/<vdag-id>
Endpoint: /vdag/query
Method: POST
Description:
This endpoint queries VDAG metrics using a MongoDB-style filter provided in the JSON request body. Supports standard MongoDB query operators like $eq, $gt, $in, etc.
Example curl Command:
curl -X POST http://<server-url>/vdag/query \
  -H "Content-Type: application/json" \
  -d '{
    "status": { "$eq": "healthy" },
    "metrics.latency": { "$lt": 200 }
  }'